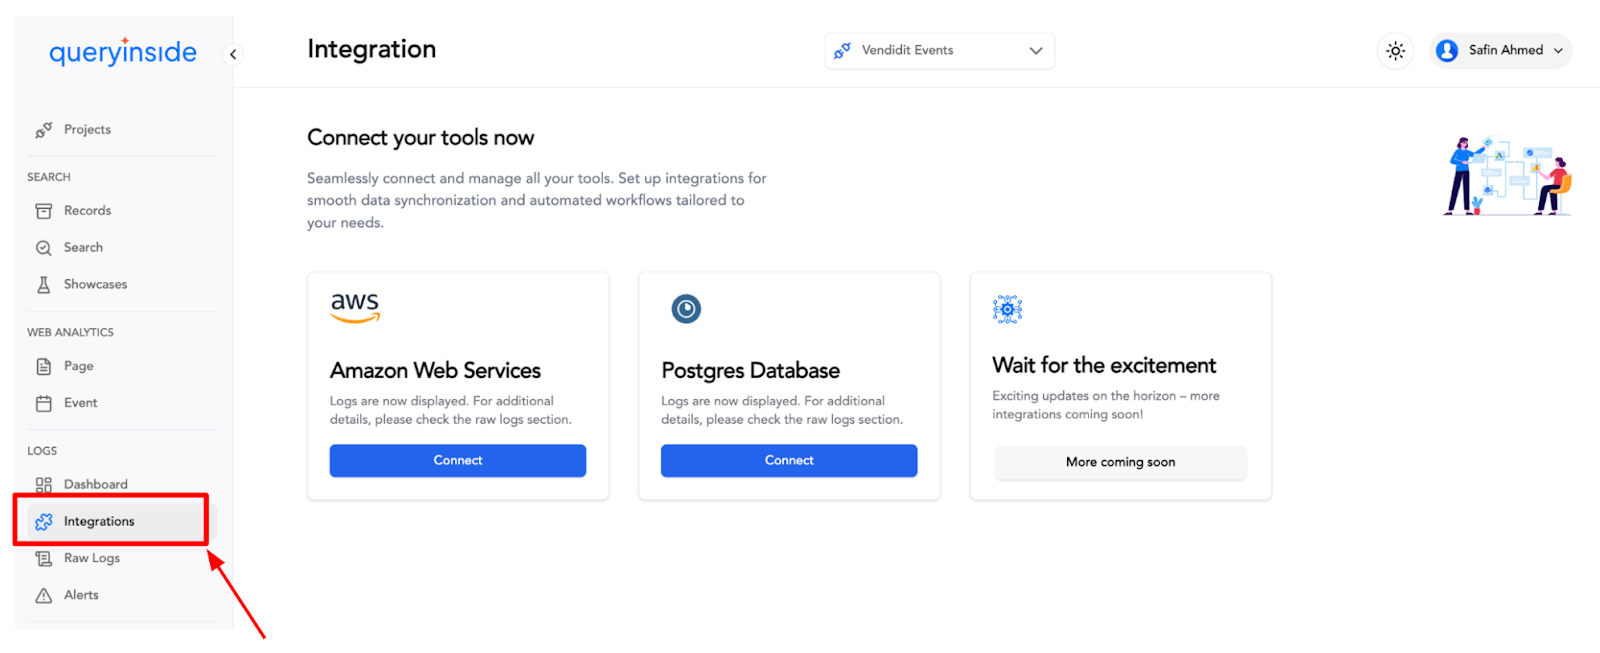
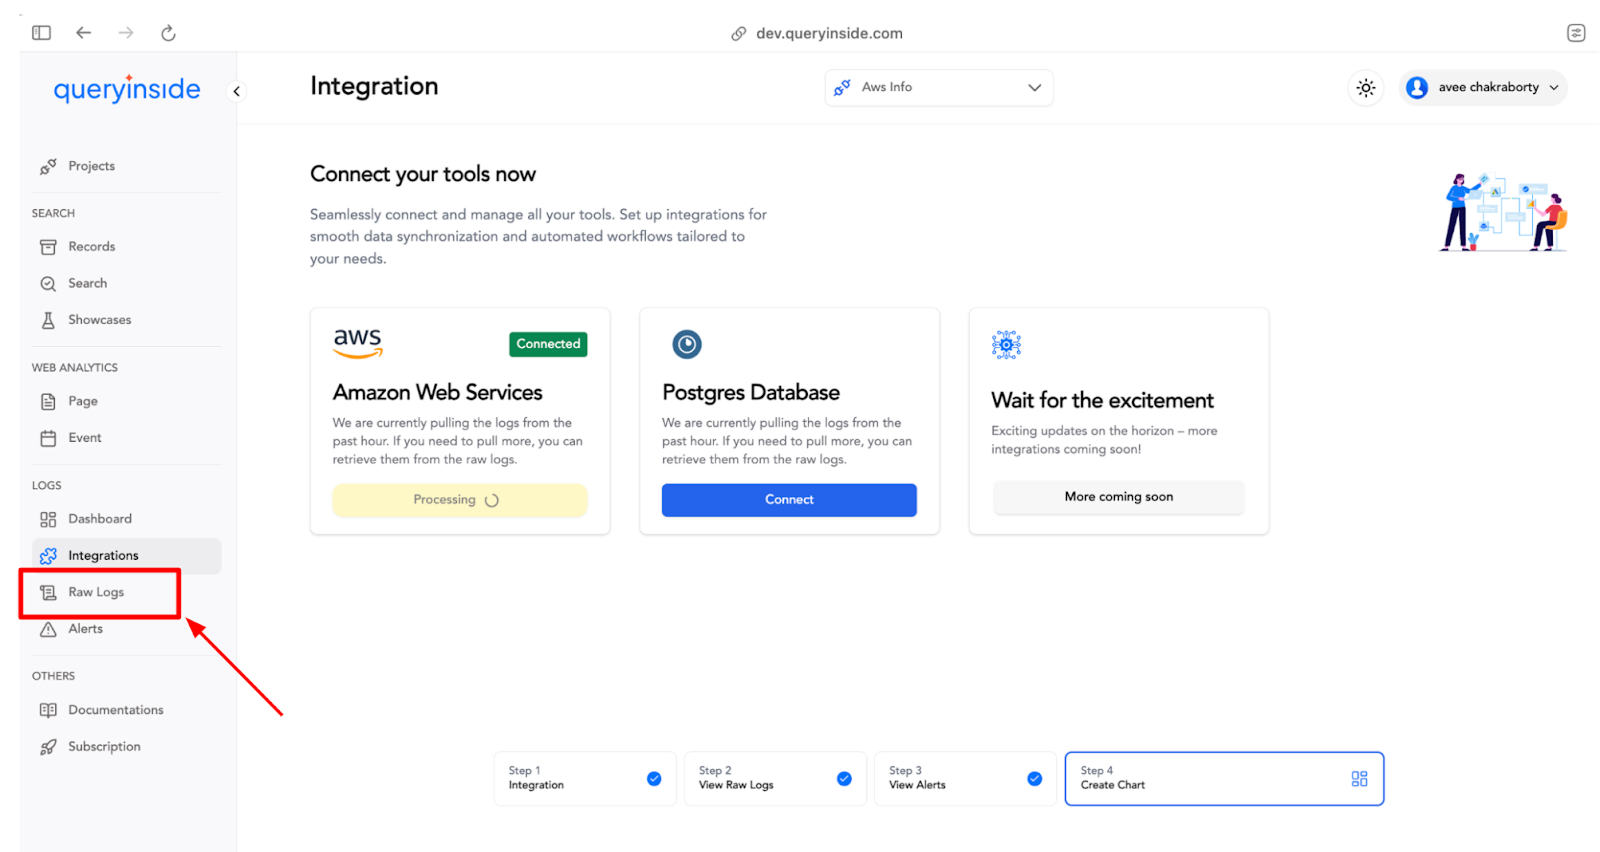
The Integration feature allows users to connect QueryInside with their existing data sources, enabling seamless data retrieval and analysis. Currently, QueryInside supports integrations with:
Amazon Web Services (AWS)
PostgreSQL Database
Once connected, QueryInside fetches data from these sources and makes it available in the Raw Logs section for further processing and analysis.
Integration Requirements
Each service requires specific credentials for authentication and connection:
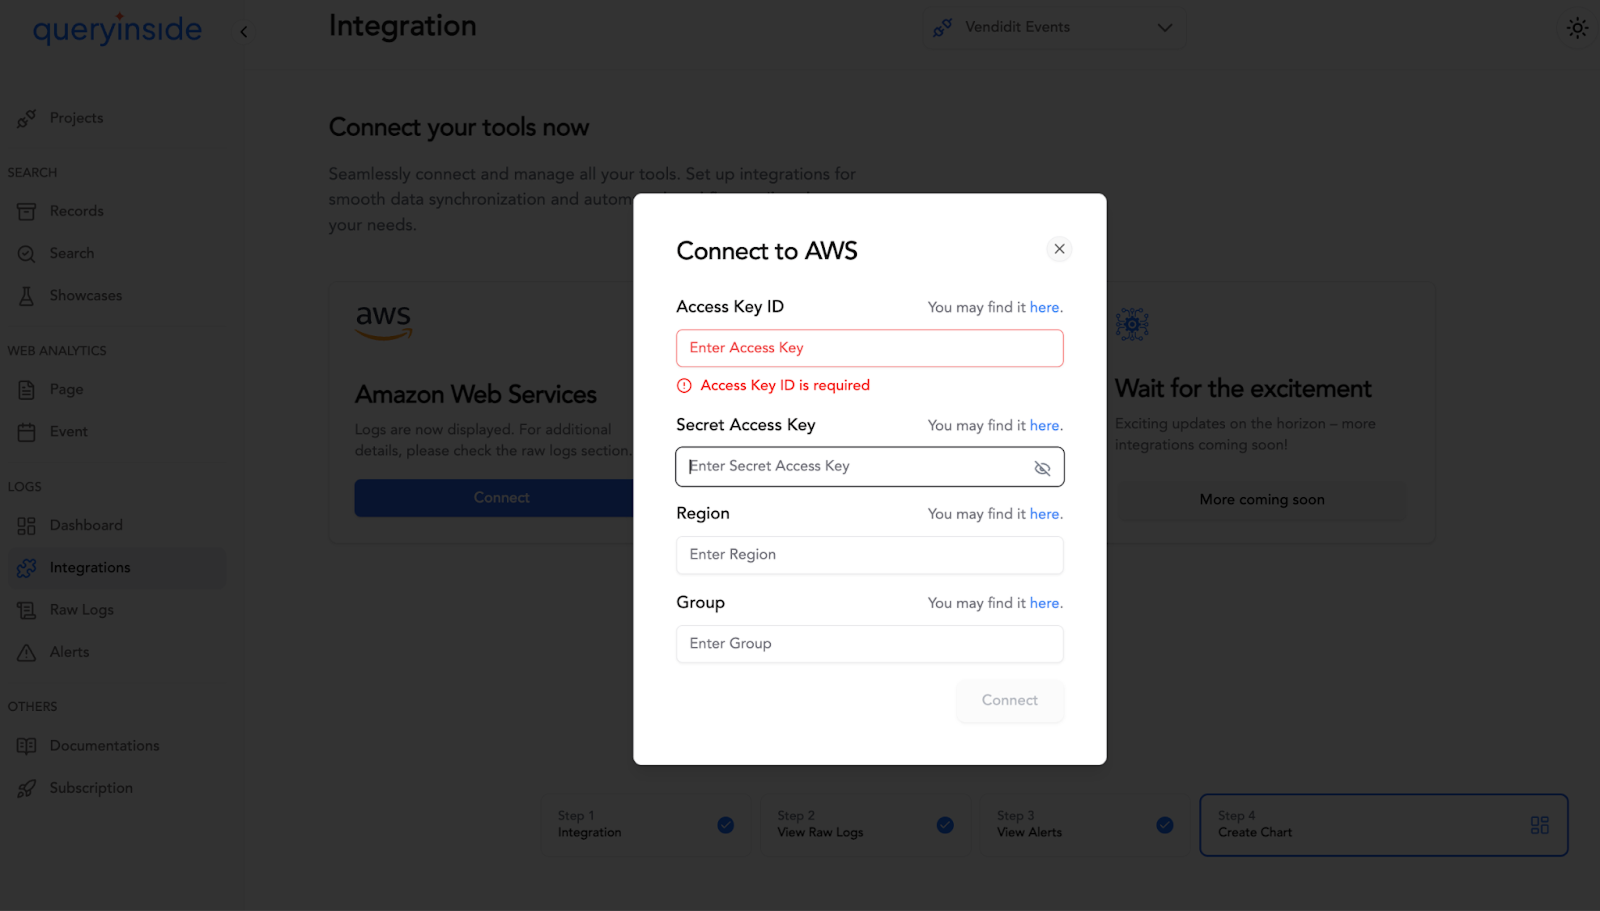
Amazon Web Services (AWS)
To integrate with AWS, users need to provide:
Access Key
Secret Access Key
Region
Group
Source Link (for reference on where to find these credentials)
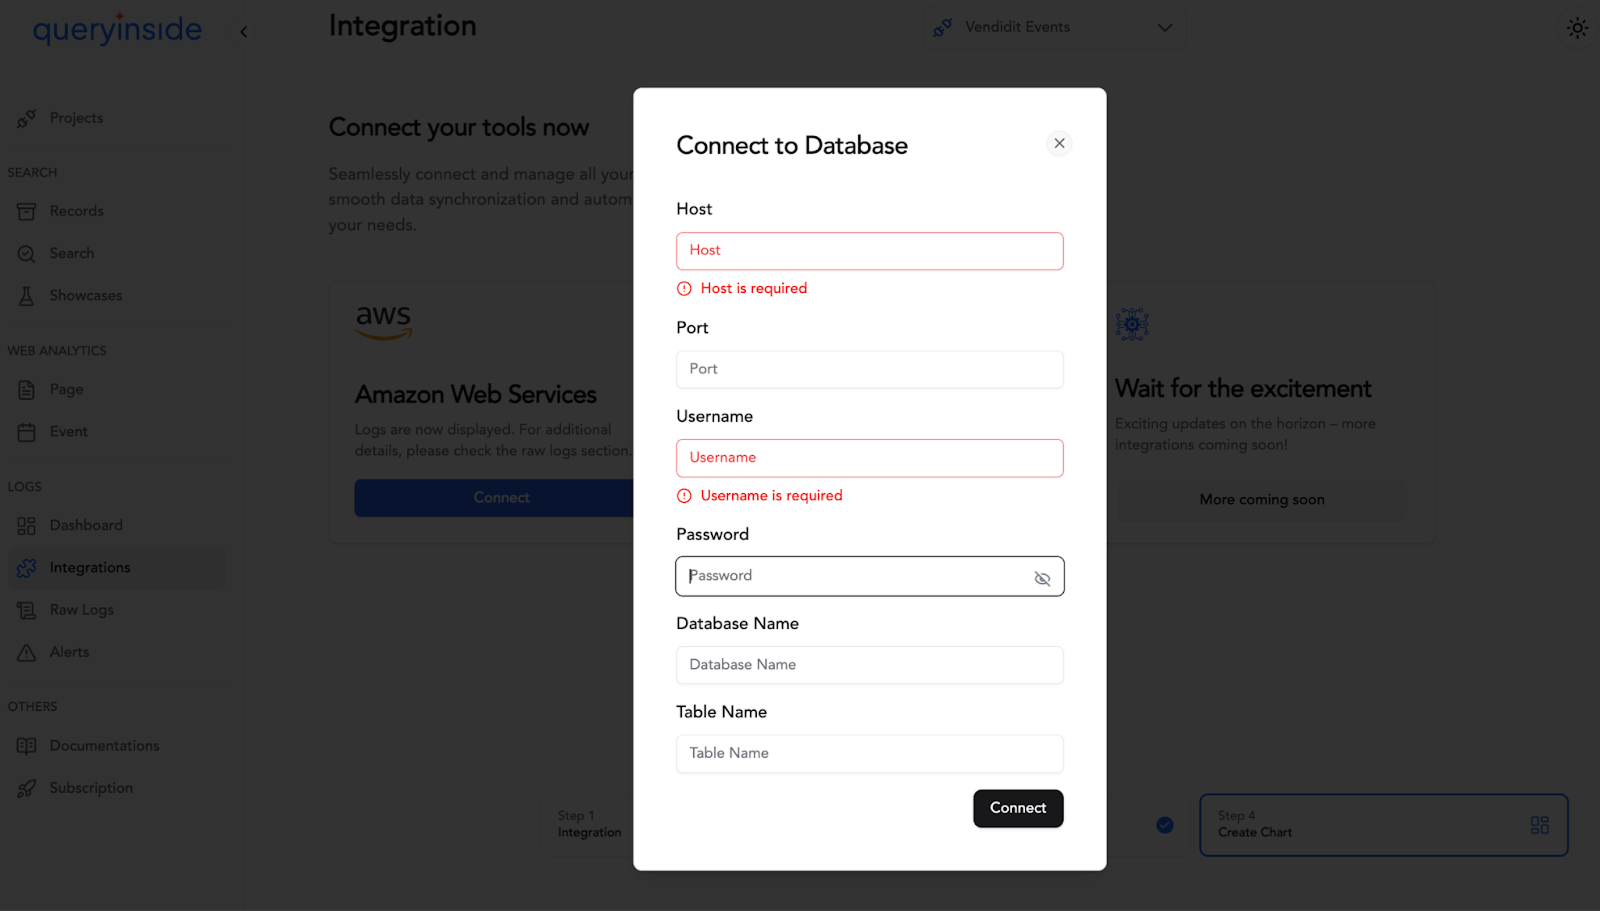
PostgreSQL Database
To integrate with a PostgreSQL database, users need to enter:
Host
Port
Username
Password
Database Name
Table Name
How to Integrate
Go to the Integration Page in QueryInside.
Select the Service (AWS or PostgreSQL).
Enter the Required Credentials as per the service selected.
Click “Connect” to establish the connection.
Once connected, QueryInside will automatically fetch data from the service.
Data Availability & Logs
After a successful integration, all fetched data will be available in the Raw Logs section.
Logs will be continuously imported from the connected services, allowing users to analyze and search their data effortlessly.
With Integration, QueryInside provides a streamlined way to connect external data sources
Section: Raw Logs
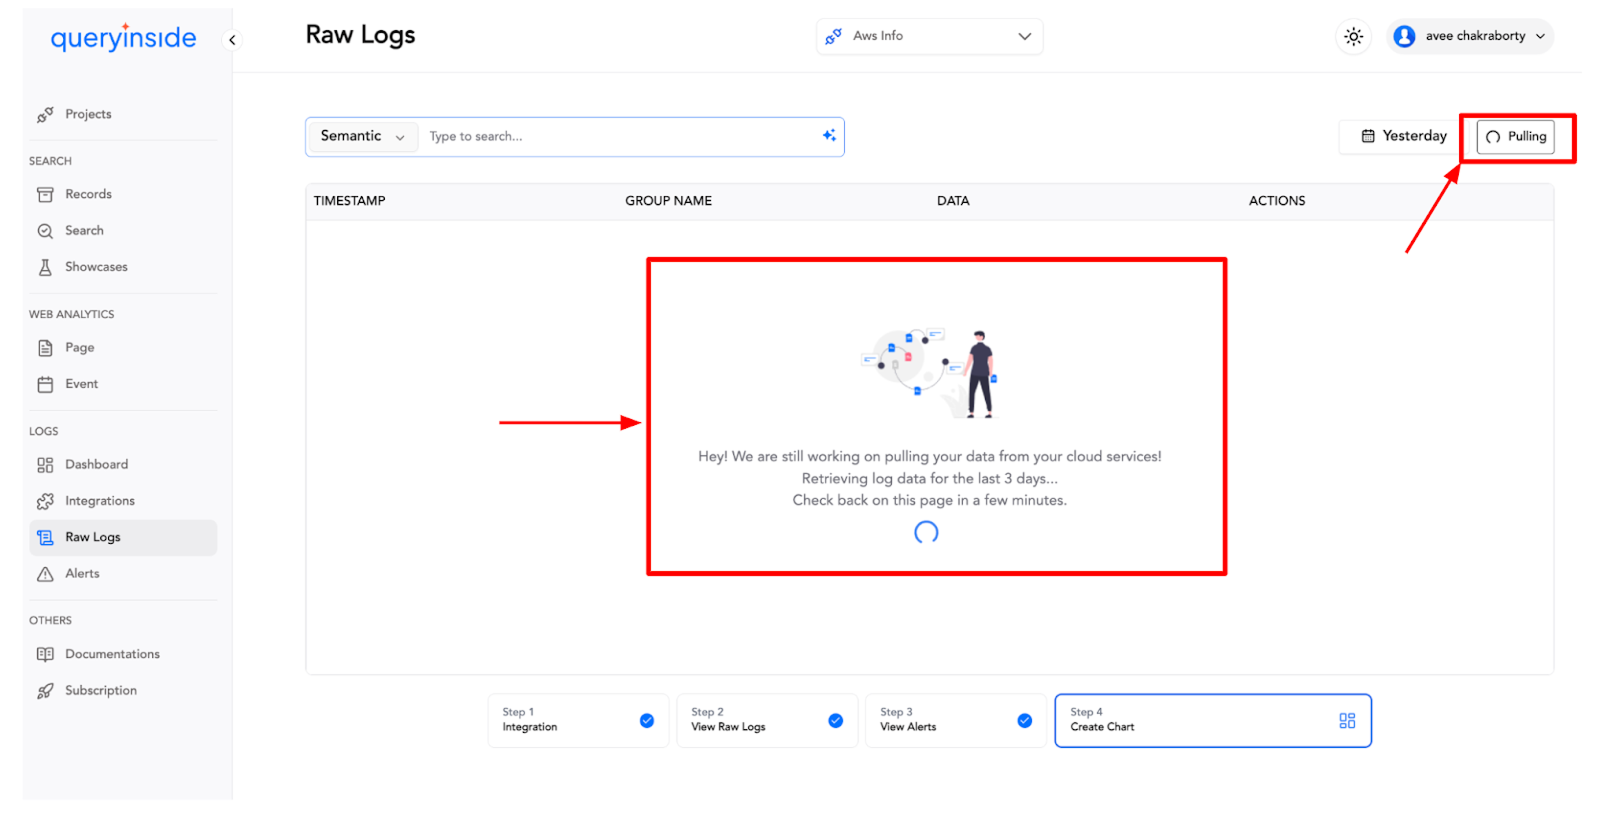
Overview
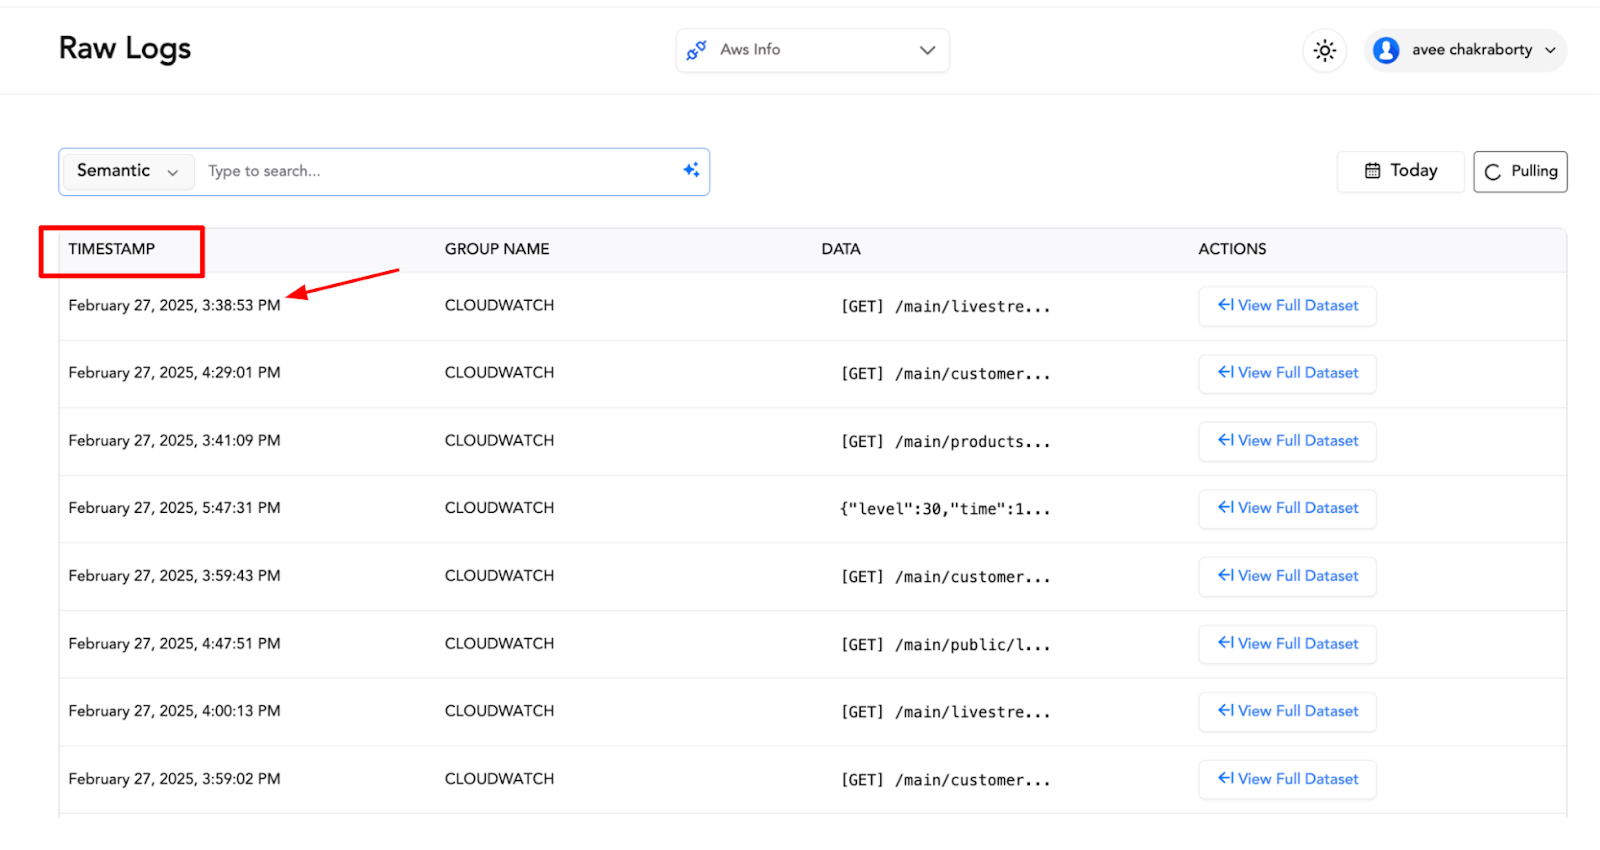
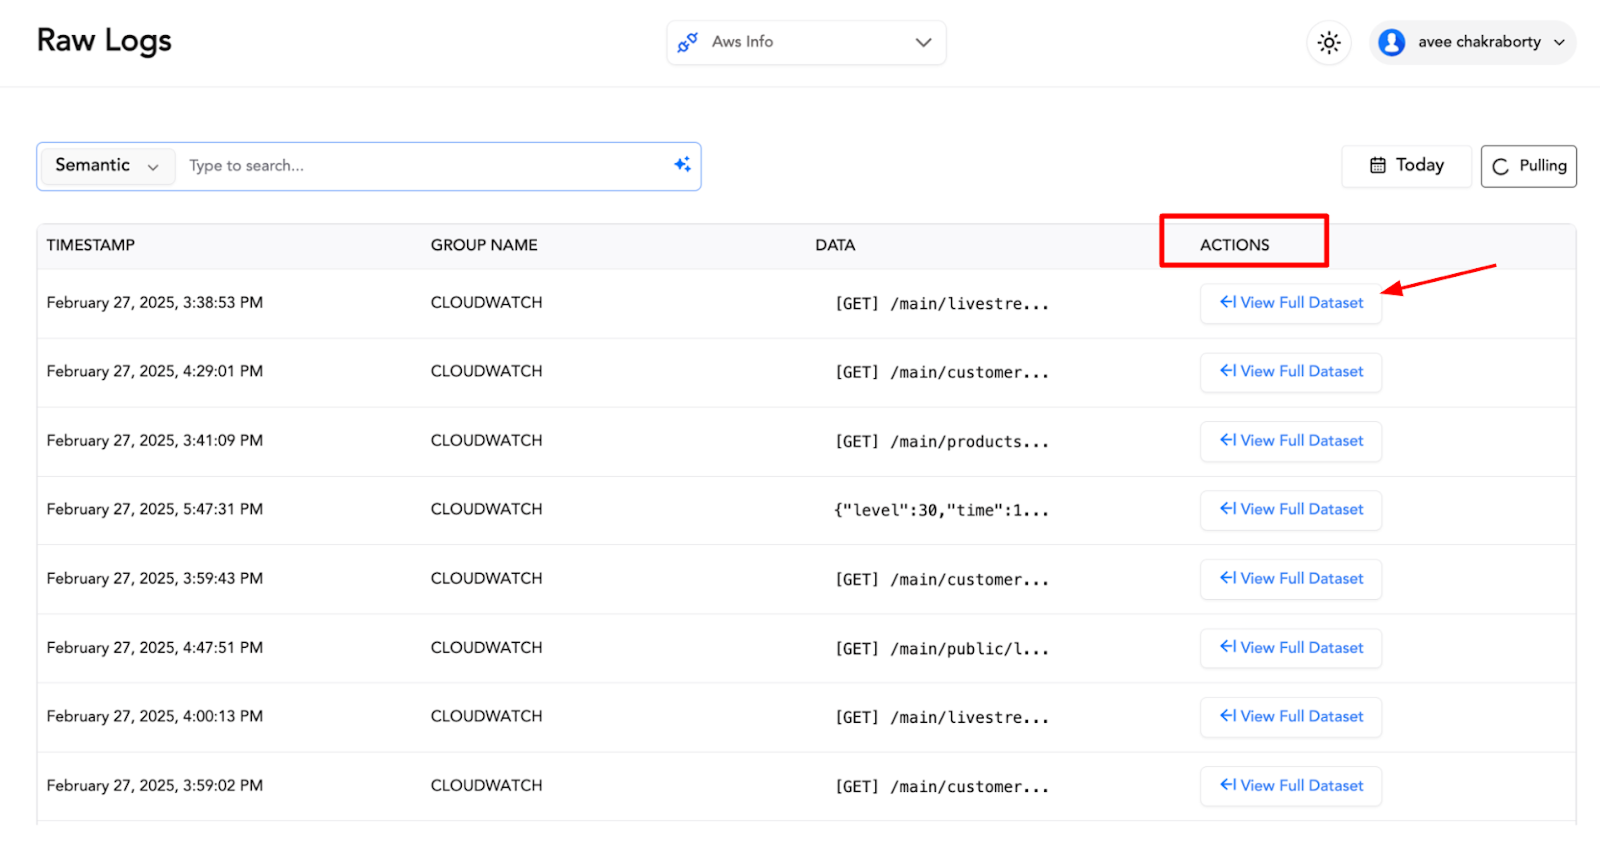
The Raw Logs section provides a comprehensive view of all imported datasets, displaying key details such as timestamps, data sources, and log previews. This section enables users to quickly review and analyze incoming logs while offering advanced search and filtering options.
Log Details
Each log entry includes:
Timestamp: Indicates when the log was created.
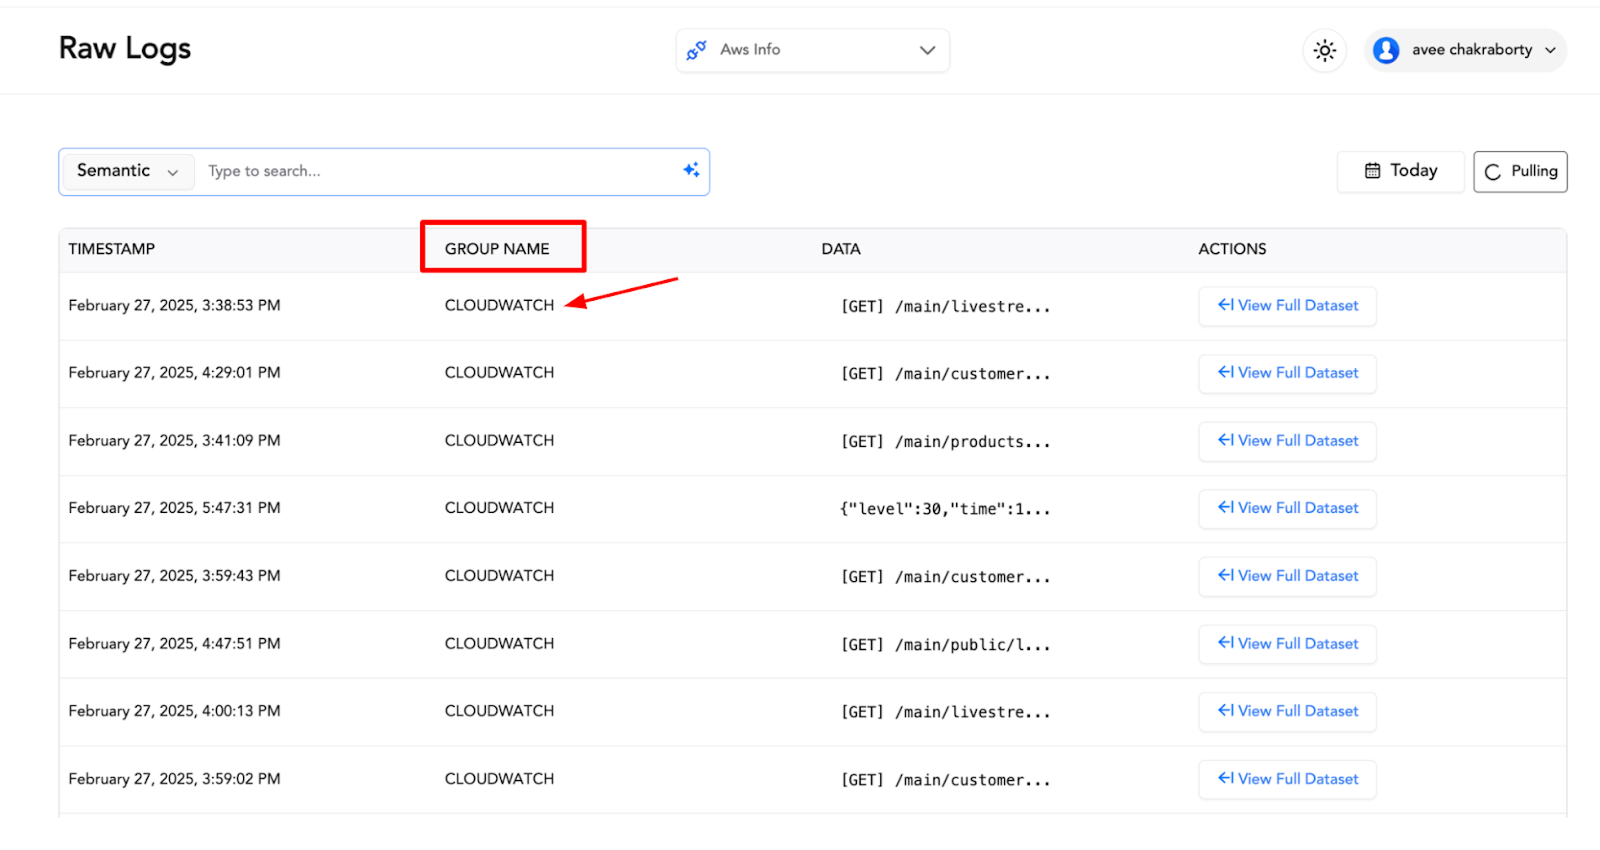
Group Name: Identifies the source of the log.
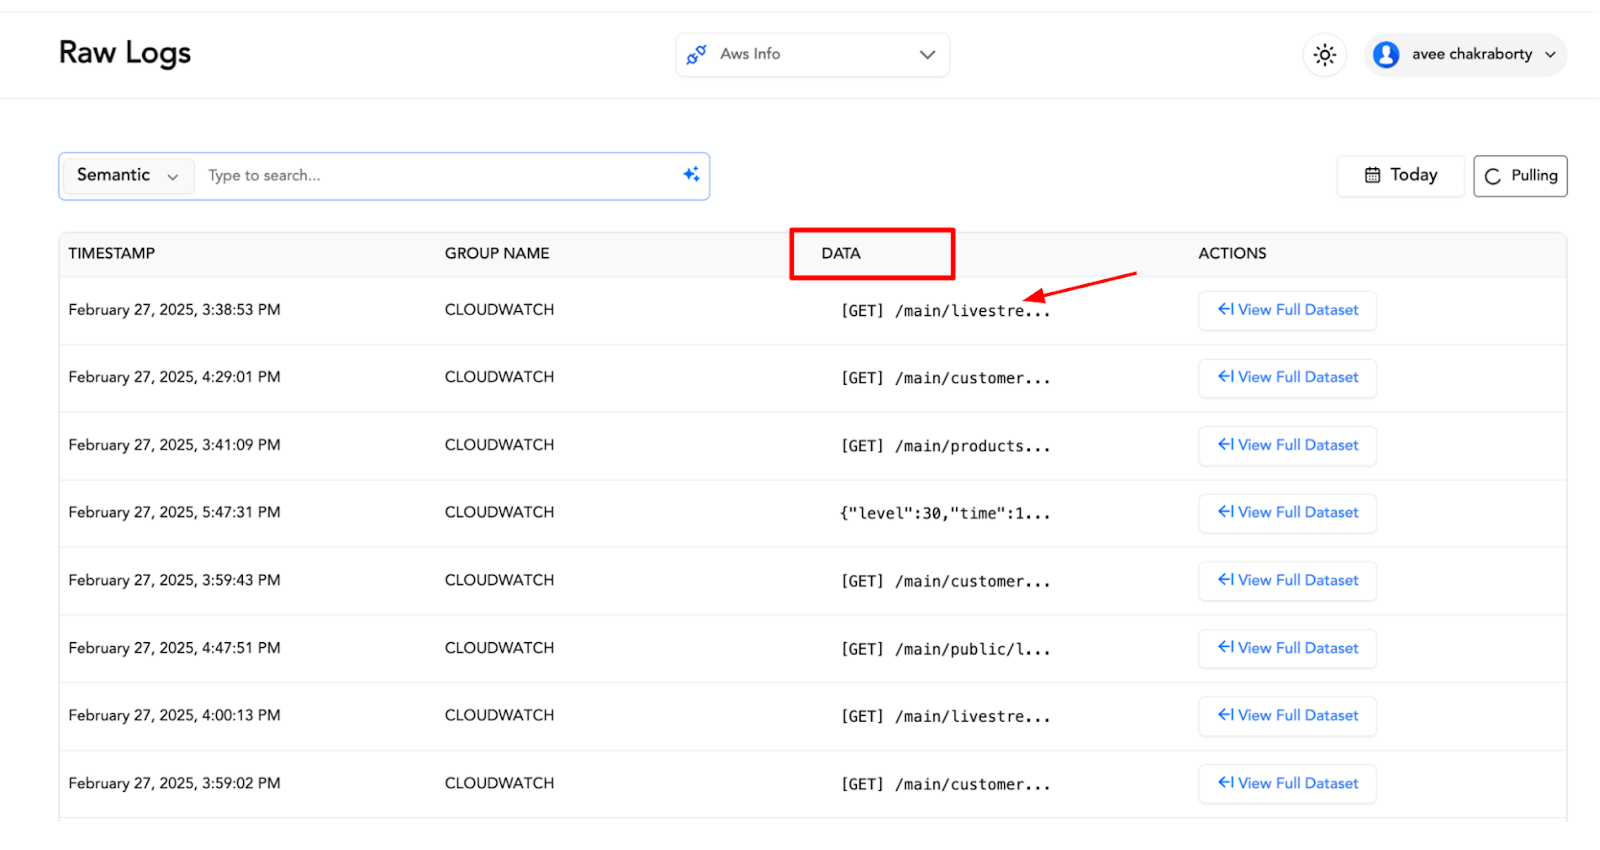
Log Preview: Provides a quick glimpse of the log’s content.
Action Button: Allows users to expand and view the full log.
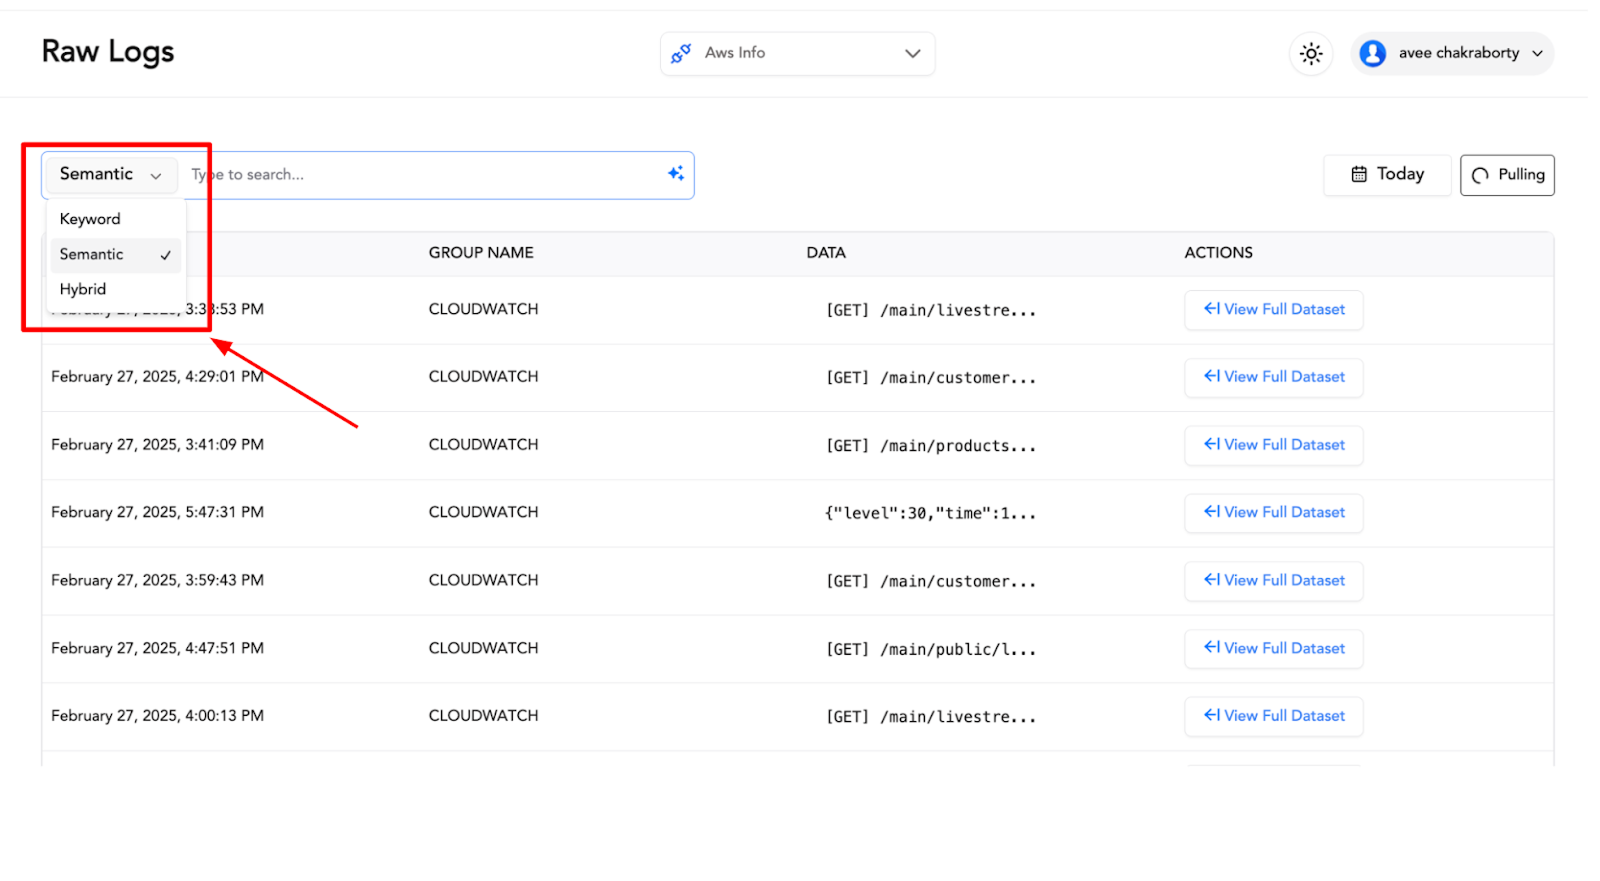
Advanced Search & Filtering
Search Methods: Users can apply Semantic Search, Keyword Search, or Hybrid Search to efficiently locate relevant logs.
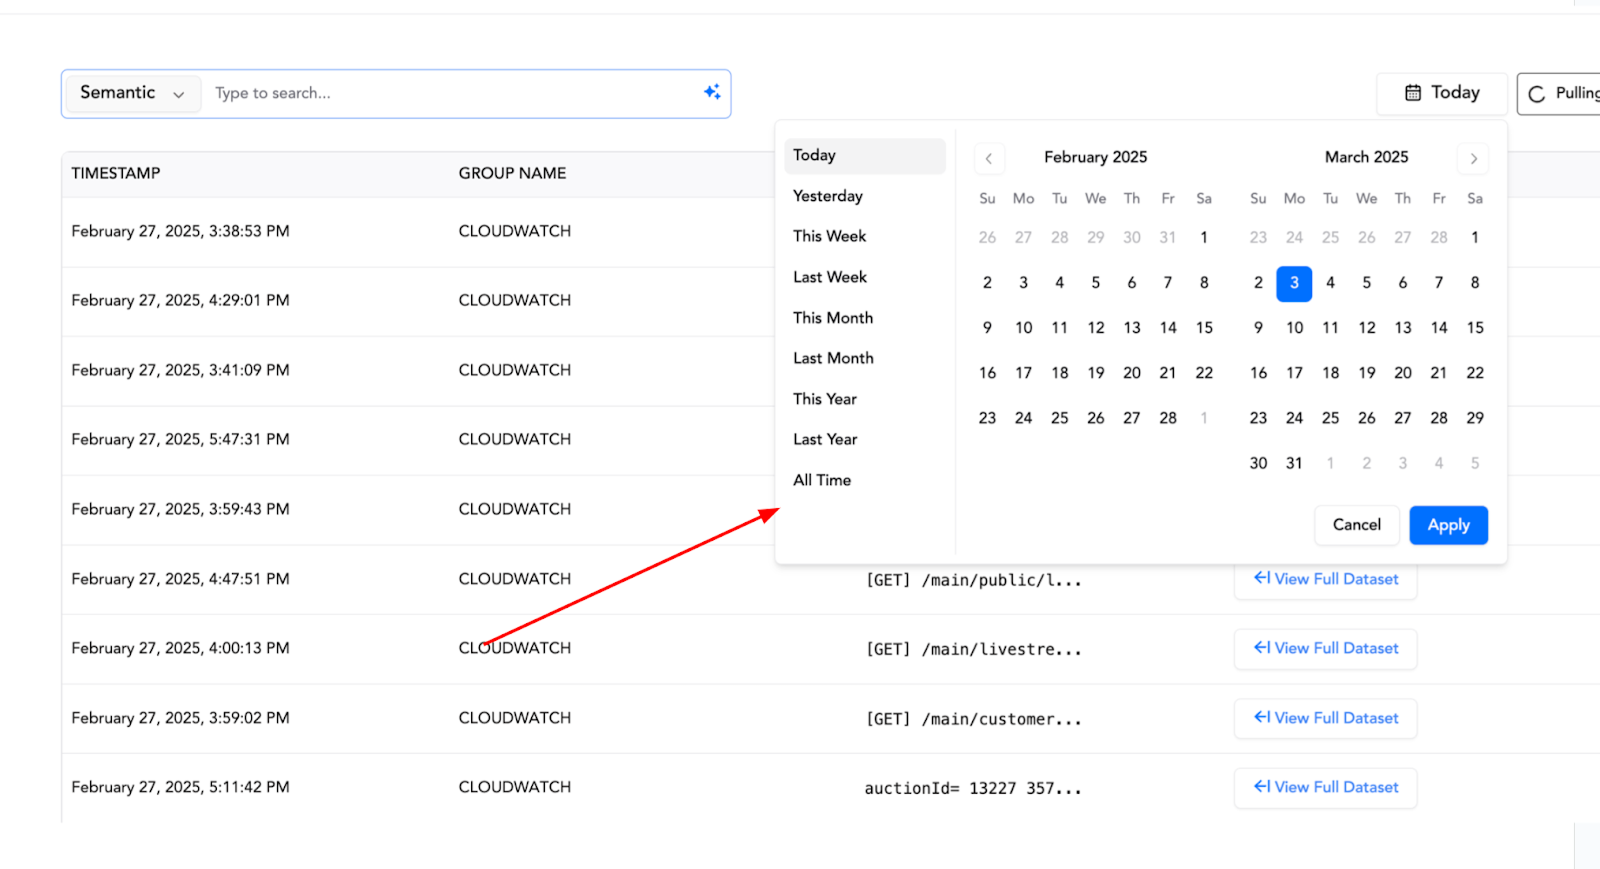
Date Picker: Enables filtering logs based on a specific timeframe.
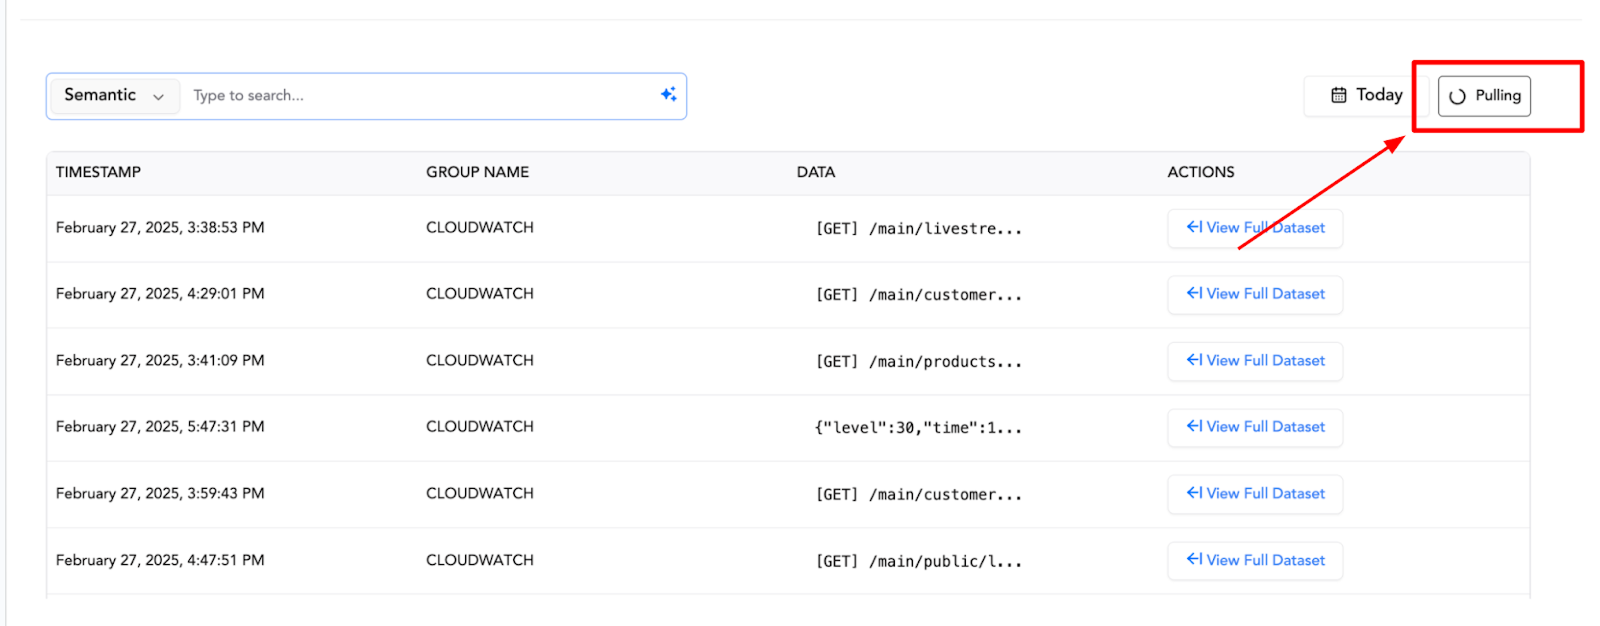
Processing Status: If logs are still being imported, a dynamic “Pulling” indicator appears, showing that data is being processed in the background.
The Raw Logs section ensures seamless log monitoring and retrieval, making it easy to analyze large datasets with precision.
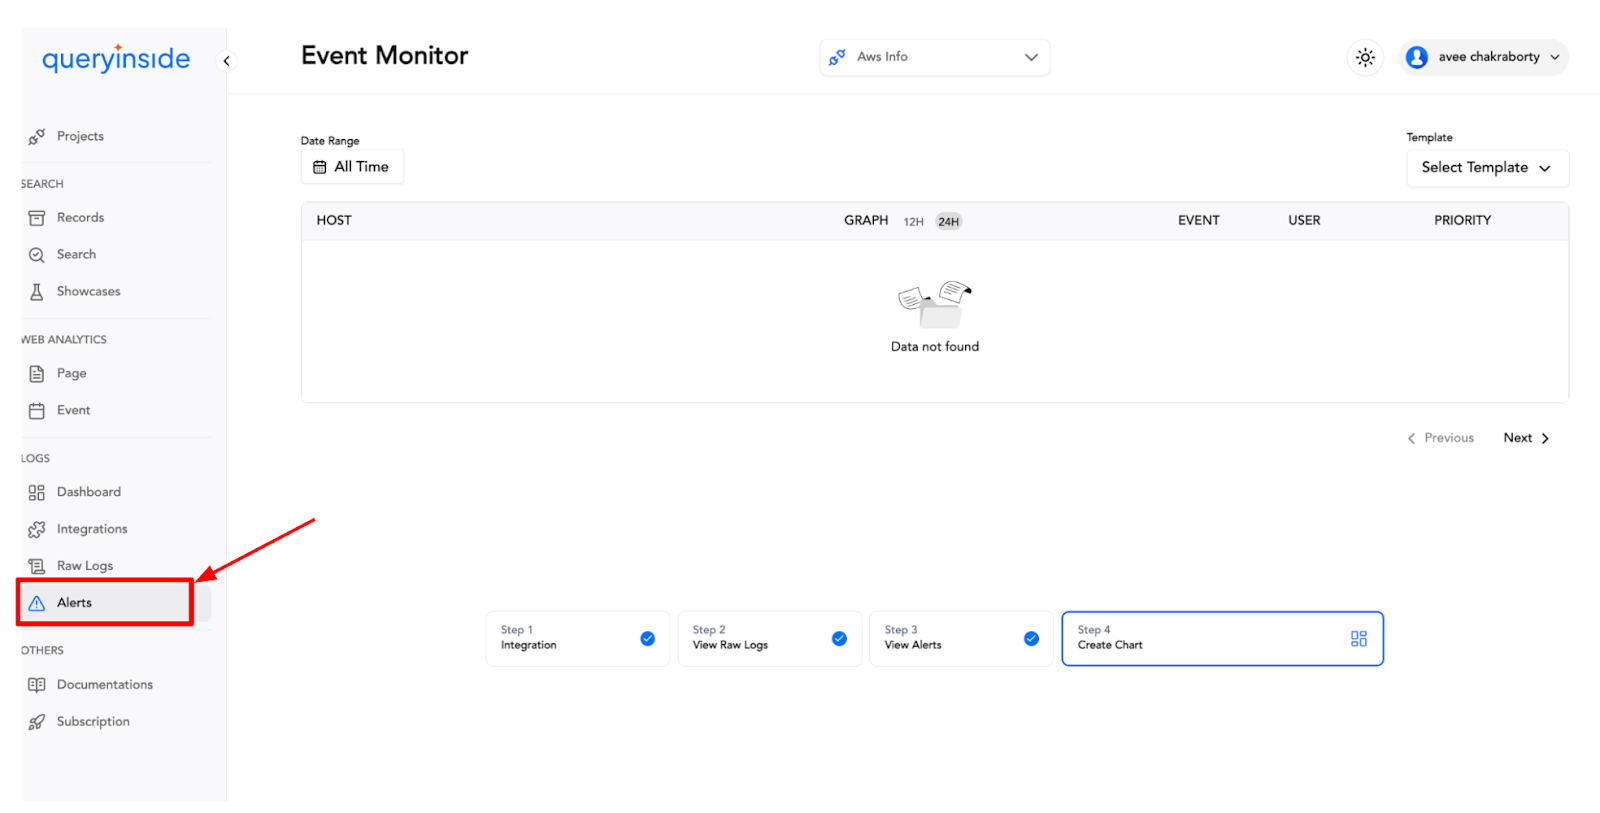
Feature: Alerts
Overview
The Alerts section provides a filtered view of log data, allowing users to set up custom templates and monitor specific events in real time. Users can configure alerts based on predefined templates or create custom templates to track key activities efficiently.
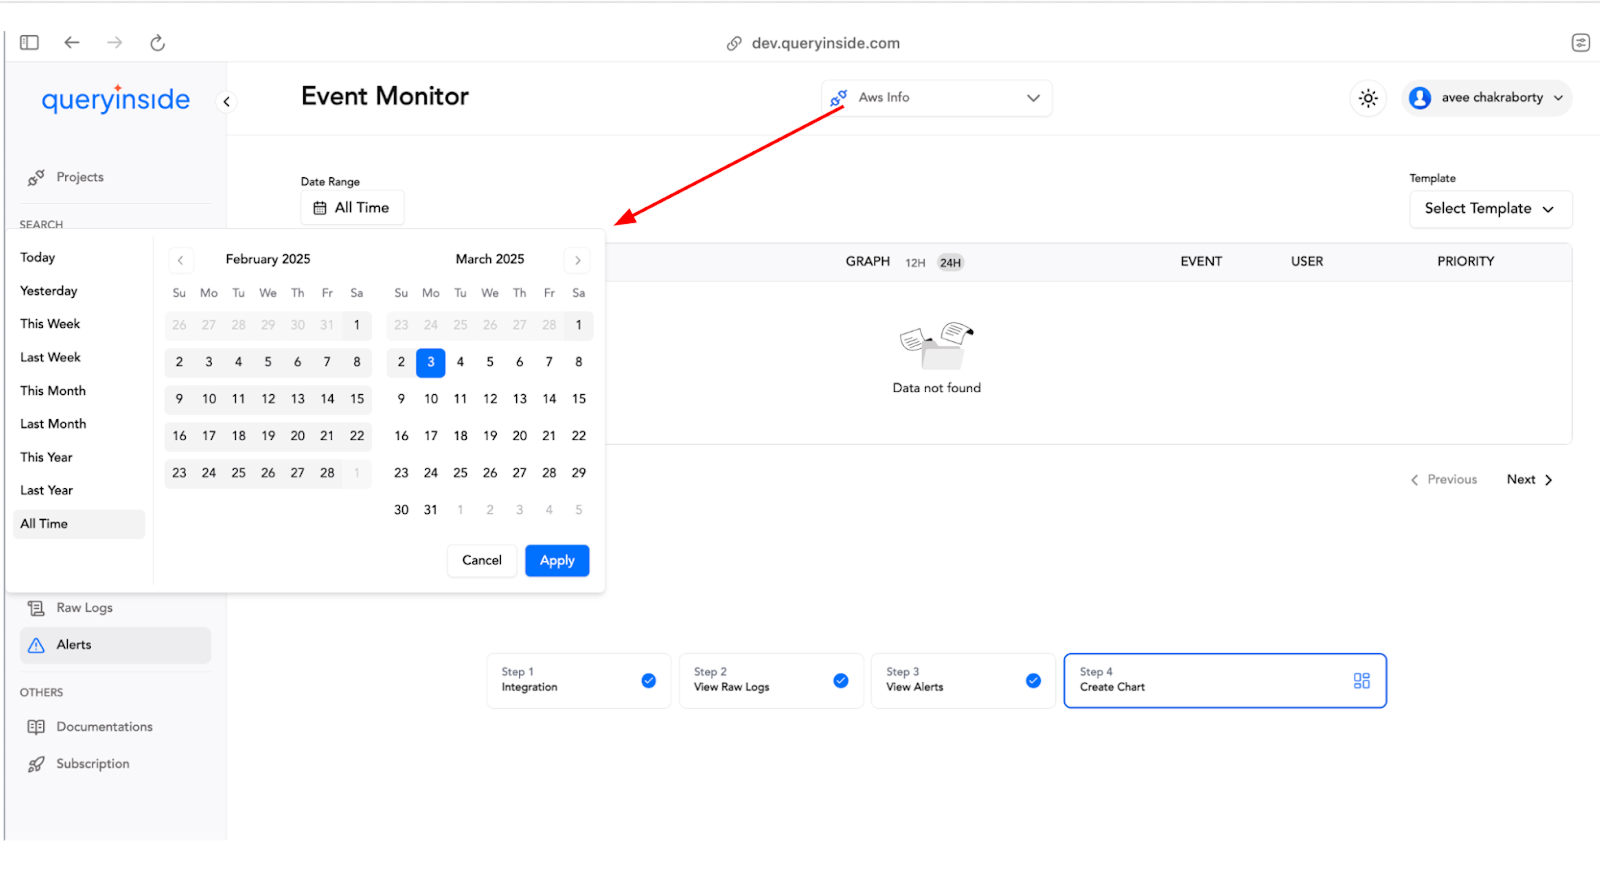
Configuring Alerts
1. Set Time Range
Use the time filter to select a specific timeframe for monitoring logs.
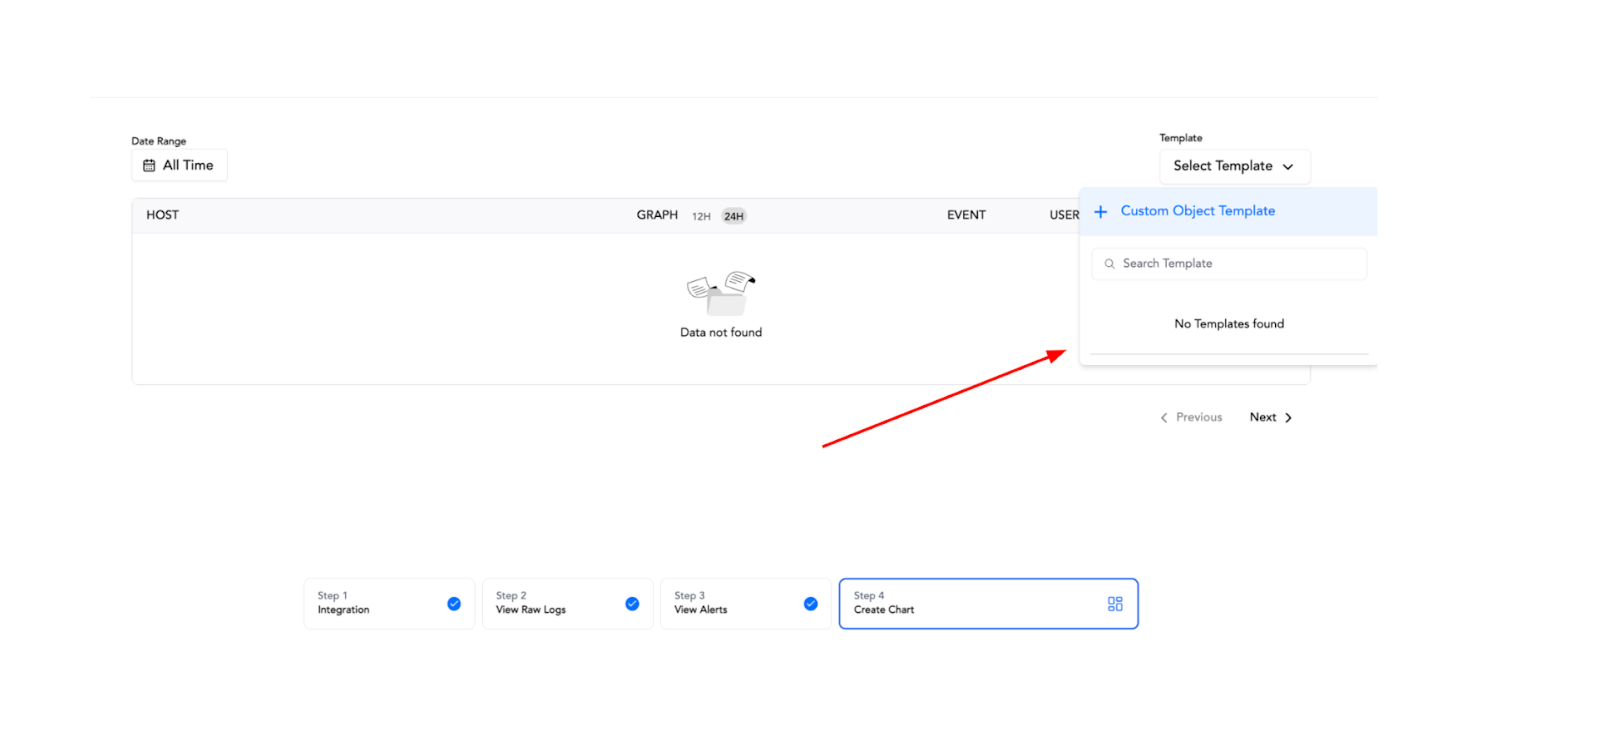
2. Choose a Template
By default, QueryInside provides a Sentry template for quick setup.
Users can copy predefined templates from the dropdown menu using the copy icon.
Alternatively, users can create a custom template based on their specific needs.
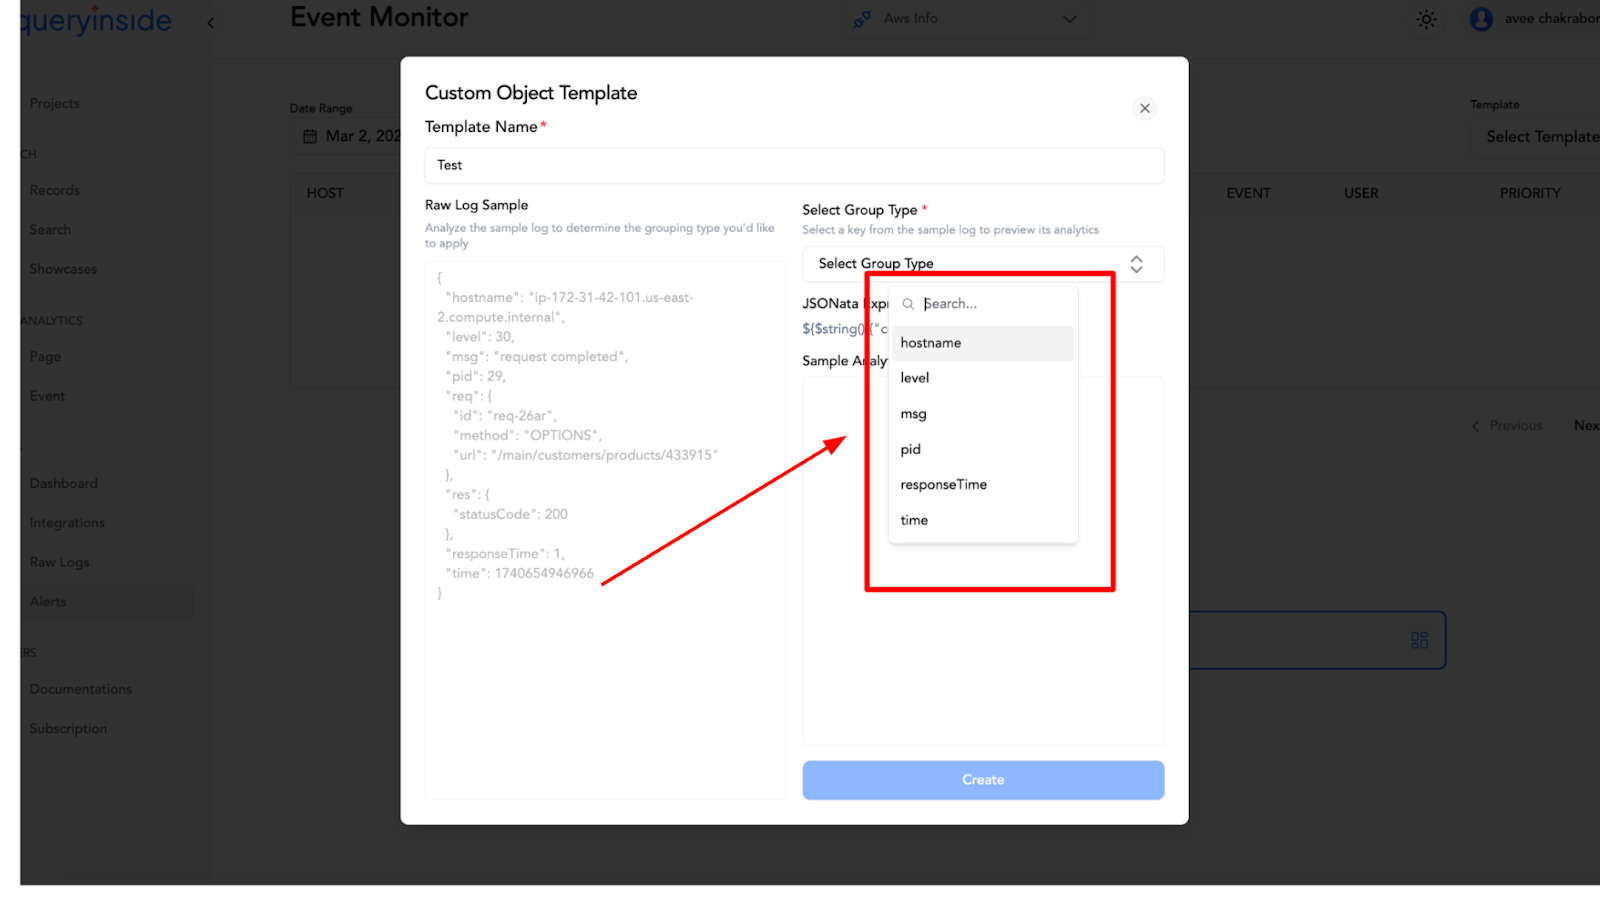
Creating a Custom Template
1. Click on the Template Section on the right-hand side.
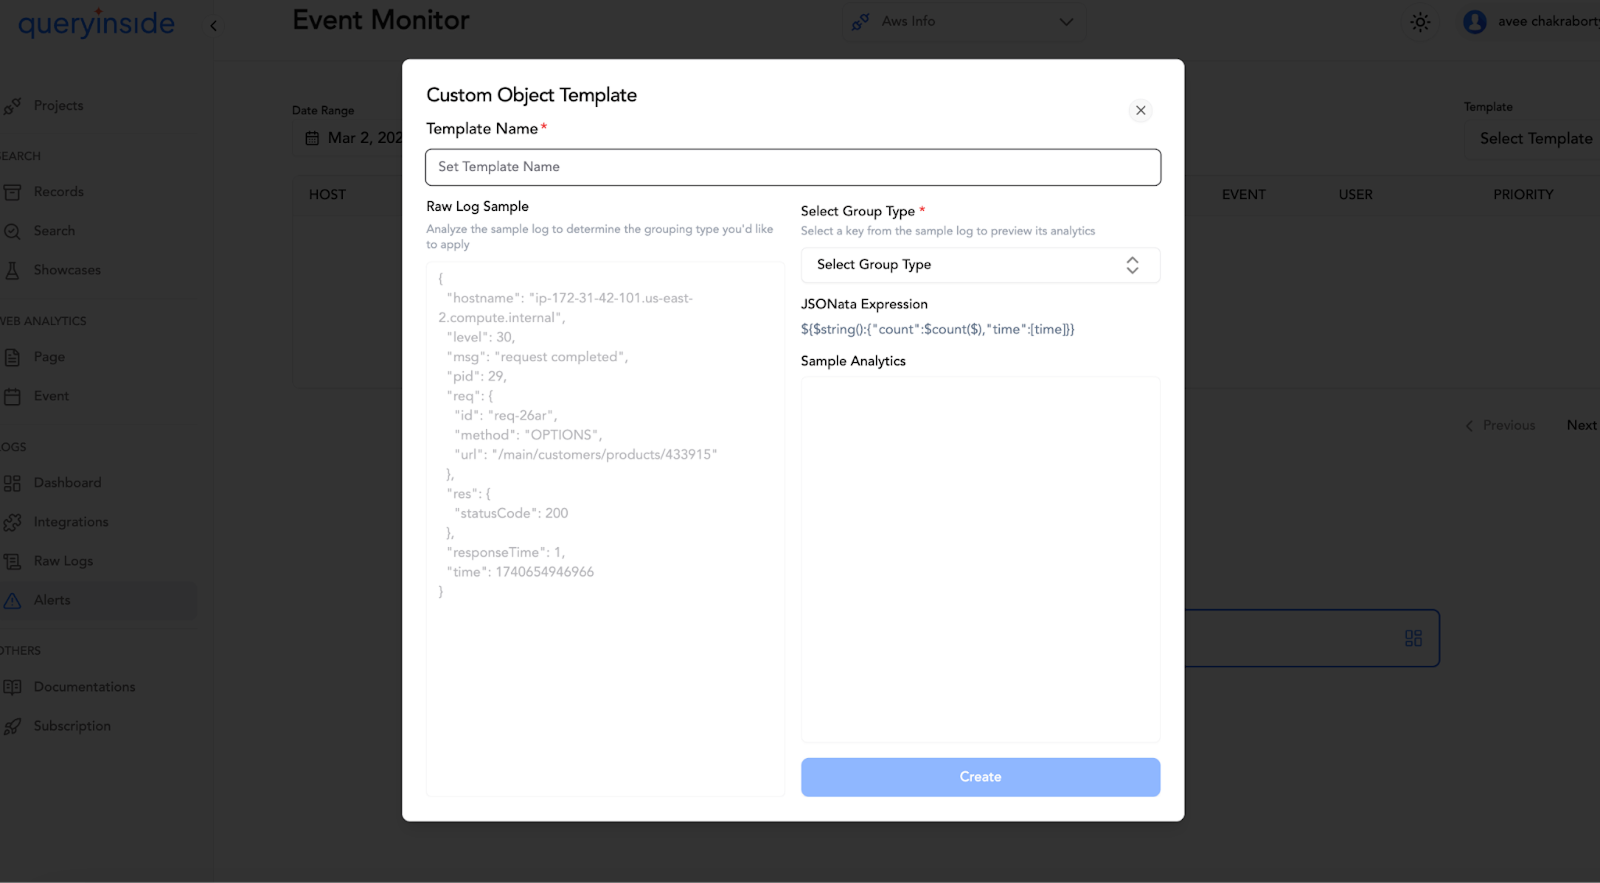
2. Select Custom Object Template and enter a template name.
3. A raw log sample from the system is displayed.
4. Choose a Group Type from the dropdown list, which provides suggested objects for selection.
5. Select the relevant objects for tracking.
6. A sample analytics preview is shown based on the selected group type.
7. Click Create to finalize the template.
Once created, the selected data is displayed in the Alerts section.
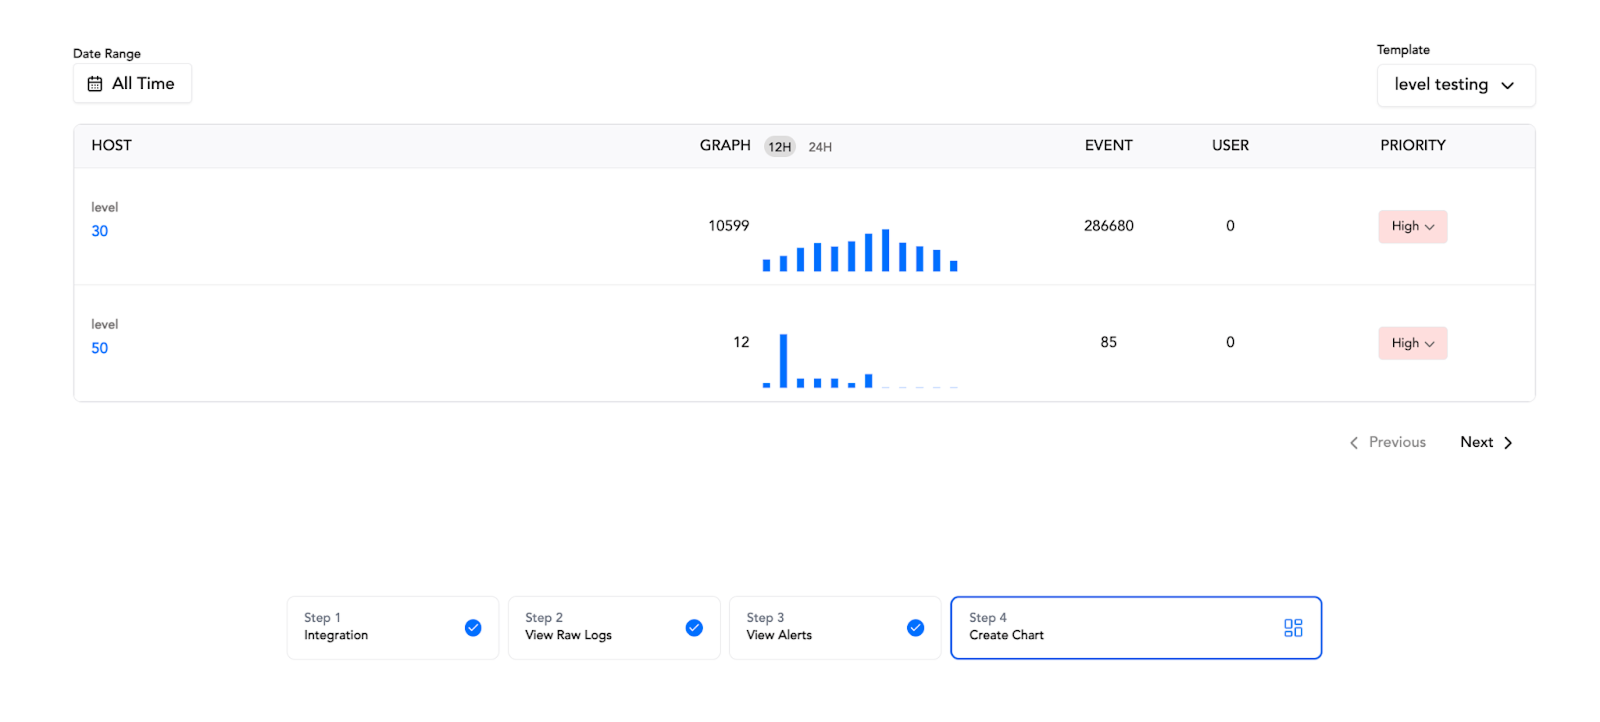
Monitoring Alerts
Hostname: Displays the specific object selected during template creation.
Activity Graph: Shows data trends over the last 12h or 24h, based on user preference.
Event Count & User Tracking: Provides the total number of events and the number of users within the selected timeframe.
Priority Status: Users can assign High, Medium, or Low priority levels to monitor critical alerts effectively.
The Alerts feature ensures real-time monitoring of key log data, helping users track and respond to events efficiently.
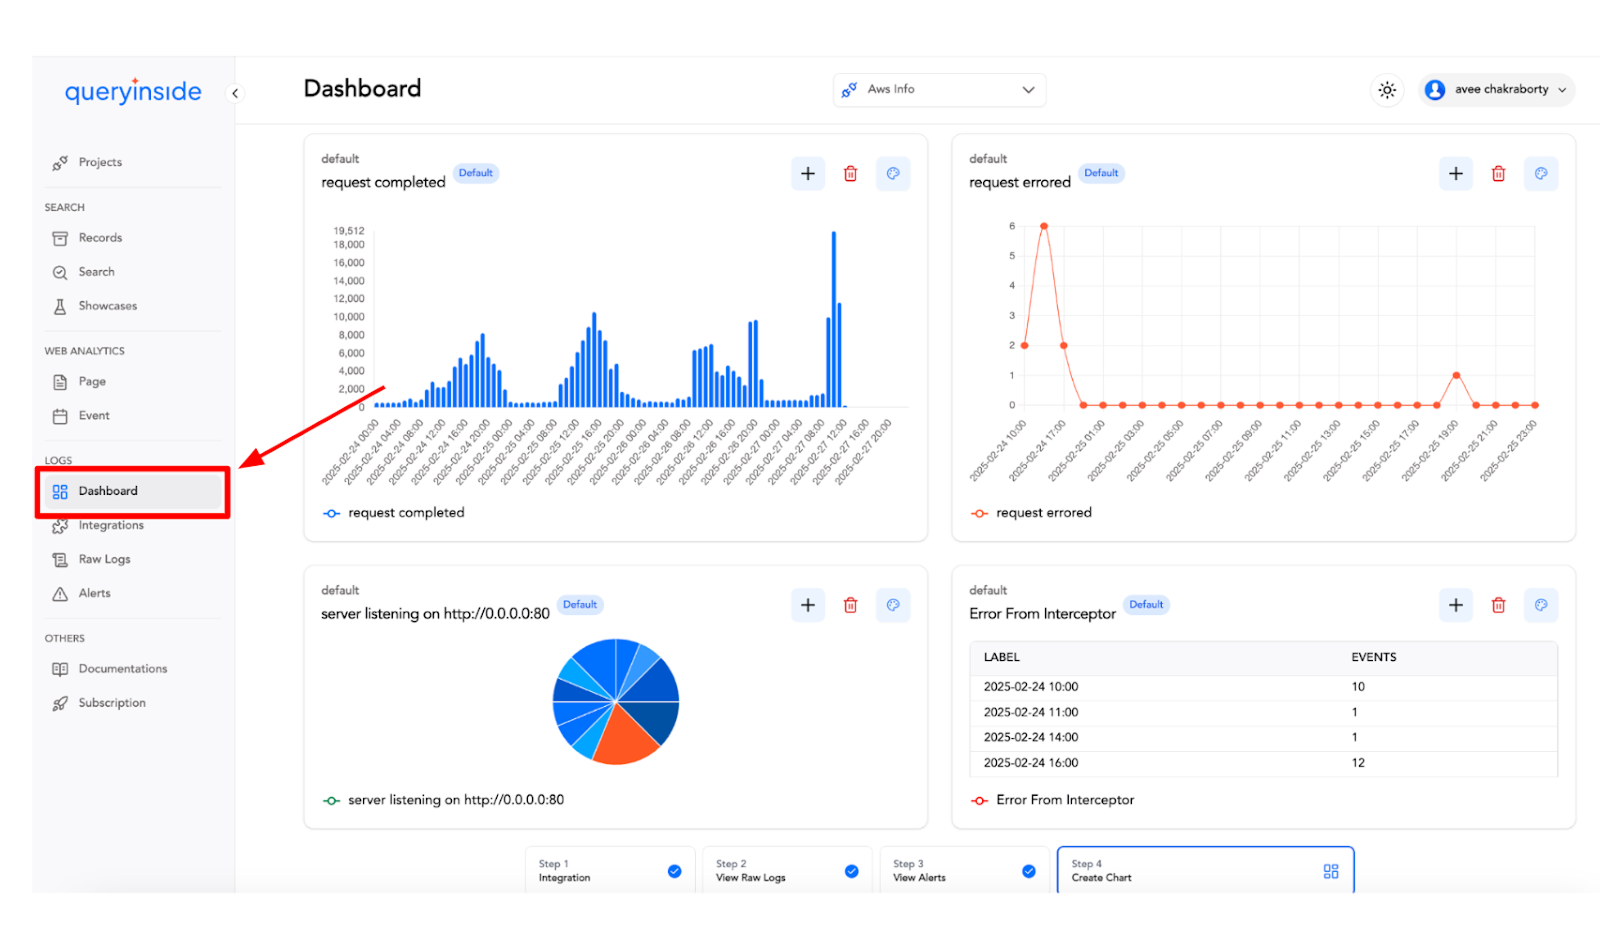
Feature: Dashboard
Overview
The Dashboard provides a visual representation of log data by displaying charts based on objects selected from the Alerts section. It allows users to monitor key metrics efficiently through customizable charts.
Default Charts & Setup
The first four objects from the selected template are automatically displayed as charts.
These charts are labeled as “Default” for user clarity.
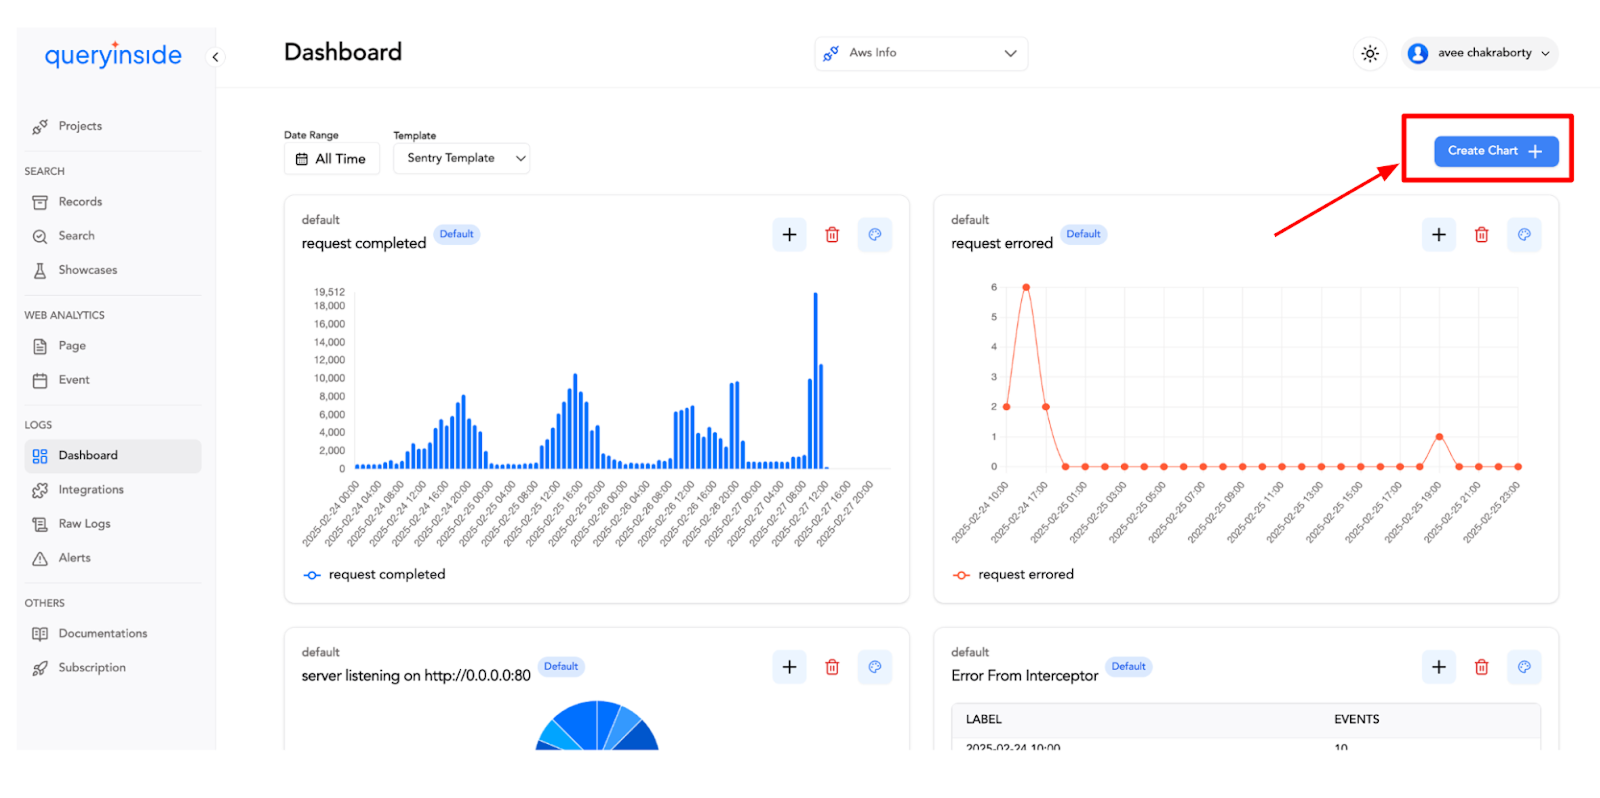
To enable the Dashboard, users need to:
Select a Date Range to filter data.
Choose a Template to from drop down.
Creating Custom Charts
Users can add additional charts for enhanced monitoring:
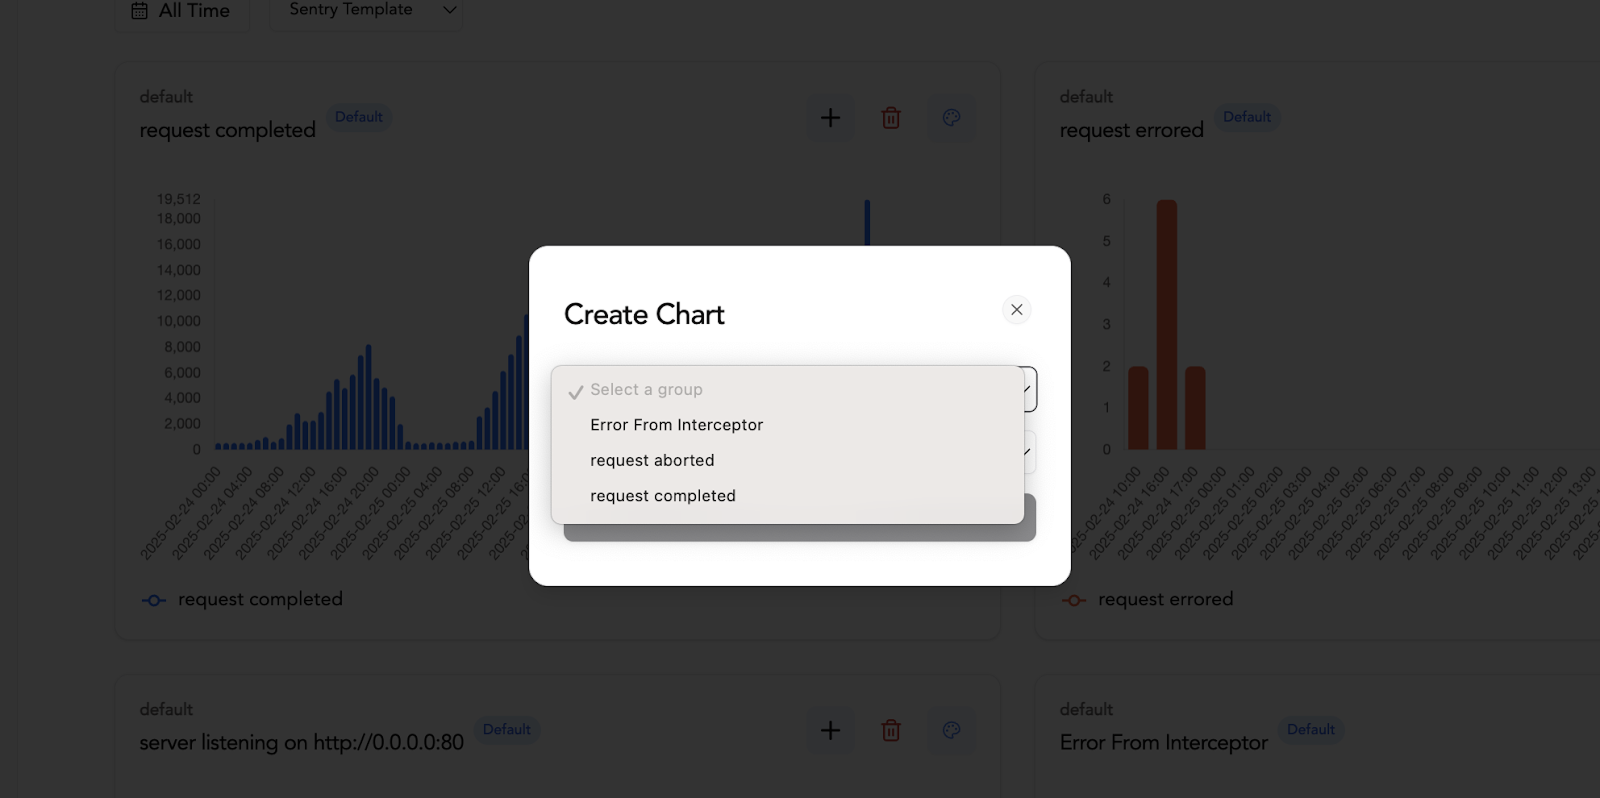
1. Click “Create Chart” on the right-hand side.
2. Select a Group from the dropdown list.
2. Choose a Chart Type from the available options:
Line Chart
Bar Chart
Pie Chart
Table
3. Click “Create Chart” to add the selected visualization to the dashboard.
Modifying & Managing Charts
Change Chart Type: Click the plus (+) icon on a chart and select a different chart type from the pop-up.
Delete Charts: Users can remove unwanted charts by clicking the delete option.
Customizable & Interactive
The Dashboard is fully customizable, allowing users to configure it based on their monitoring needs. With the ability to add, modify, or delete charts, users can optimize their dashboard layout to track the most relevant application data effectively.