I’ve spent a lot of late nights digging through messy logs, from overloaded servers, unpredictable cloud systems, and nonstop event streams and I remember how overwhelming it felt. If you’ve ever been in that same spot, staring at a wall of text trying to make sense of it all, you’re not alone. That’s actually one of the reasons I became such a fan of Queryinside’s Log Analytics Workspace. It takes that chaos and turns it into something you can work with, something that actually helps you move forward instead of holding you back. In this 2025 guide, I want to walk you through what it is, how it works, and how you can start getting real, meaningful value from it today. My hope is that by the end, you’ll feel the same sense of clarity and confidence that I did.
Quick Overview: Log Analytics Workspace Explained
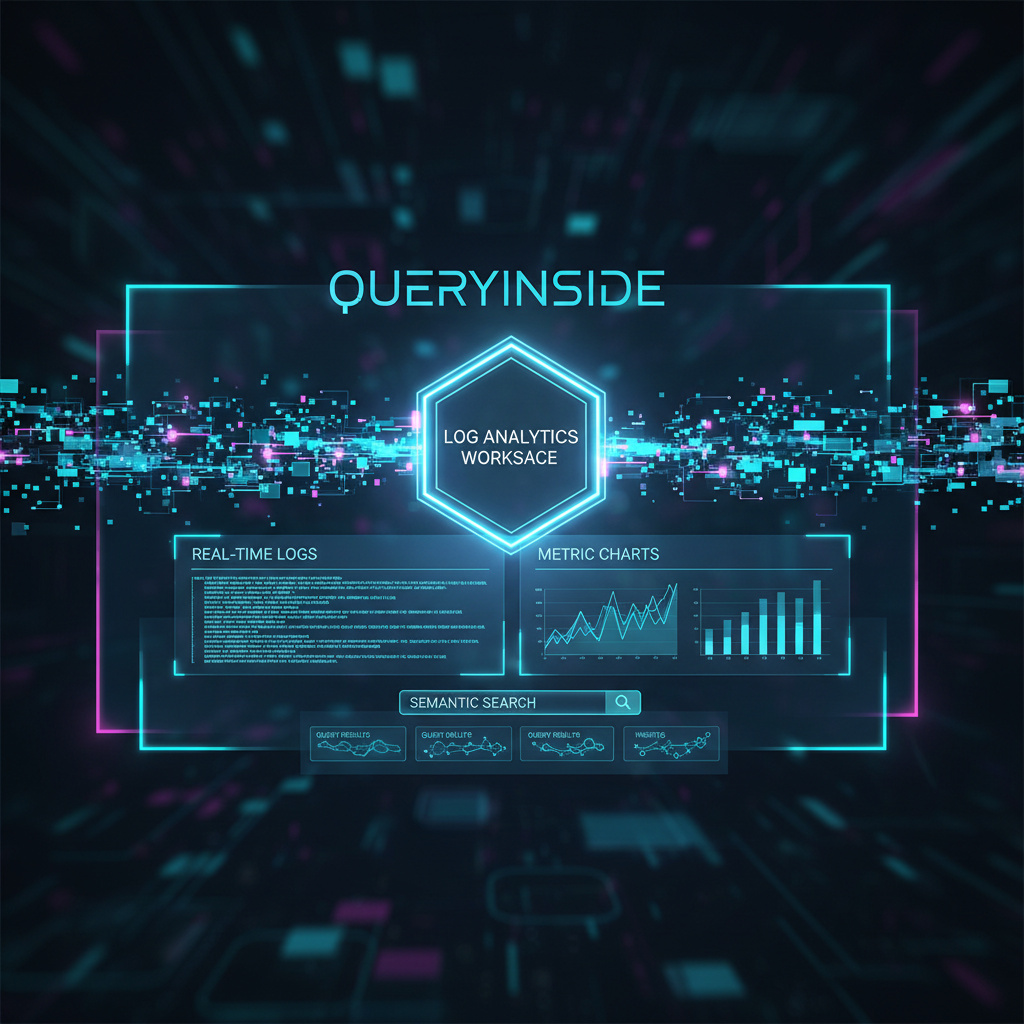
A Log Analytics Workspace in Queryinside is your central hub for collecting, searching, and analyzing all your system’s log data whether it’s application events, server logs, raw database entries, or custom event streams. Instead of piecing together data from spreadsheets and console logs, Queryinside brings everything into a unified, AI-driven interface that’s built for fast insights. queryinside
You can connect data sources like AWS logs, database tables, CSVs, and more. Once data is flowing in, it lands in the Log Analytics Workspace where you can search it using powerful tools, filter with precision, and create alerts and dashboards that tell the story of what’s happening in your systems. queryinside+1
What Data Lives in the Workspace?
Logs typically include:
- Timestamps
- Event messages
- Source identifiers
- Metadata like user IDs or event types
Once integrated, this data becomes instantly searchable, filterable, and visualizable a dramatic improvement over manual log review. queryinside
Core Features of Queryinside Log Analytics Workspace
AI-Powered Semantic Search
One of the biggest differentiators of Queryinside is its AI-enhanced search engine. You don’t need perfect keywords to find what you’re looking for the system understands context. Whether you’re searching for error rates, user sessions, or specific patterns, semantic search combines keyword matches with meaning to deliver relevant results. queryinside
This isn’t simple text search it’s a contextual search layer that interprets your intent so that “failed login attempts” and “login errors” return the same relevant results without perfect query syntax.
Advanced Filtering & Raw Logs View
Once logs are ingested, the Raw Logs section lets you review individual events with key details like timestamp, source, and snippet of content. You can apply filters by date range, severity, and custom fields. This makes deep investigations much faster than combing through endless lines of text manually. queryinside
Real-Time Alerts & Custom Templates
Want to know the instant something important happens? Queryinside lets you define custom alert templates based on patterns or thresholds that matter to your operations. You pick the conditions, and Queryinside watches the data. When the event fires you get notified. queryinside
Templates can be prebuilt or fully customized, which is especially useful if you’re monitoring complex app behavior or critical performance indicators.
Interactive Dashboards
Dashboards provide visualizations that highlight trends and patterns across your logs. You can create charts, graphs, and summary tables based on selected data slices. These visual tools put insights front and center so your team can quickly identify bottlenecks or opportunities. queryinside
How It Works: Step-by-Step
Integration & Data Sources
To start using Queryinside, you connect your data sources. Whether it’s logs from AWS, PostgreSQL database tables, CSVs, or API-driven streams, you only need the appropriate credentials and connection setup. Once connected, Queryinside continuously pulls in new events and records. queryinside
Searching & Filtering Logs
With your data inside the workspace, the search interface lets you:
- Perform semantic searches
- Apply keyword filters
- Use date pickers to narrow time windows
- Drill into raw log entries
The result: you spend minutes finding specific issues instead of hours. queryinside
Setting Up Alerts
Alerts are built from templates. You choose conditions like:
- “Error count > 50 in last 10 minutes”
- “Failed authentication events > 10 in an hour”
Once set, the system monitors incoming logs in real time and notifies your team when thresholds are crossed. queryinside
Visualizing with Dashboards
Dashboards let you display charts that update as new data arrives. You can monitor:
- Event frequencies over time
- Top event types
- System performance
This turns raw log data into actionable insights instantly. queryinside
2026 Updates: What’s New and Notable
Queryinside continues evolving, and in 2026 there are a few notable enhancements:
Improved Search Accuracy
Semantic search is now more robust and context-aware, reducing noise and improving relevance even when your query terms are vague or incomplete. queryinside
Dashboard Enhancements
The dashboard system has received UI and performance improvements, making it easier to customize layouts and share insights across teams. queryinside
Smarter Alerts
Alerting logic has been expanded so conditions can be combined more flexibly, making it easier to monitor complex event conditions across large datasets. queryinside
Best Practices for Teams Using Queryinside
- Start with Clear Data Sources: Configure logs from all critical systems and make sure timestamps and identifiers are consistent.
- Use Semantic Search Liberally: Don’t be afraid to write plain English queries Queryinside’s AI will interpret them effectively.
- Set Alerts Based on Actionable Triggers: Focus on conditions that indicate real impact (e.g., spike in errors or slow performance).
- Build Dashboards That Align With Team Needs: Operational dashboards for engineers and summary dashboards for business stakeholders keep everyone aligned.
Conclusion: Take Control of Your Logs in 2026
A Queryinside Log Analytics Workspace is more than just a repository for logs it’s a hub for understanding what’s happening in your systems right now. With AI-powered search, flexible alerting, and easy-to-use dashboards, it puts actionable insights at your fingertips.
Ready to streamline how your team searches, analyzes, and monitors logs? Start with Queryinside today connect your data, set up alerts, and turn raw logs into real business insights.